Chart API
DontManage provides easy-to-use and fully configurable SVG charts. You can learn about them in the DontManage Chart's documentation.
dontmanage.ui.RealtimeChart
new dontmanage.ui.RealtimeChart(dom_element, event_name, max_label_count, data)
Creates a new RealtimeChart instance that adds real-time data update functionality on top of the DontManage Chart API.
dom_element: HTML Element to be used to render the Chart.
event_name: Socket event which will provide the data stream.
max_label_count: Maximum number of labels allowed on the x-axis.
data: Data for the chart to be initialized with.
// Empty data array
const data = {
datasets: [
{
name: "Some Data",
values: [],
},
],
};
// Realtime Chart initialization
let chart = new dontmanage.ui.RealtimeChart("#chart", "test_event", 8, {
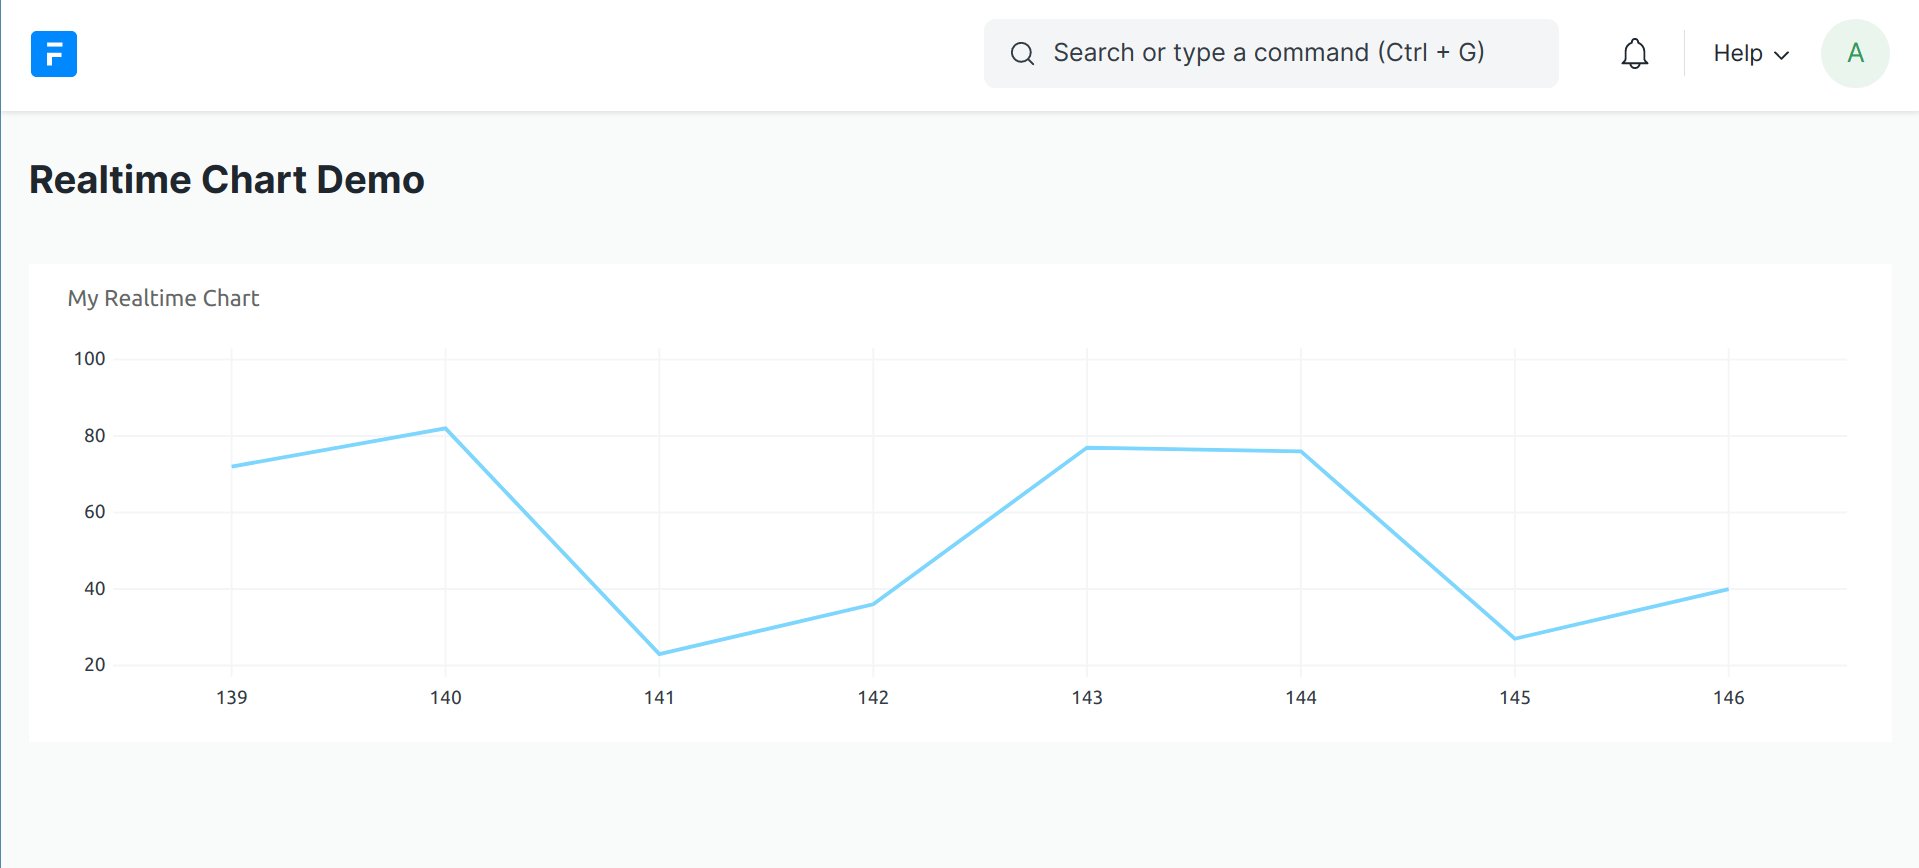
title: "My Realtime Chart",
data: data,
type: "line",
height: 250,
colors: ["#7cd6fd", "#743ee2"]
});
Here is the sample client code to render a chart over the specified socket event.
The following python code can be executed as a cron job using Hook functionality.
data = {
    'label': 1,
    'points': [10]
}
dontmanage.publish_realtime('test_event', data)
The label key specifies the label to be appended in the Chart. The points key specifies the array of points to be plotted. The number of values in the points array depends on the number of datasets.
This would produce a Chart like
dontmanage.ui.RealtimeChart.start_updating
dontmanage.ui.RealtimeChart.start_updating()
Start listening to the specified socket event and update the RealtimeChart accordingly.
dontmanage.ui.RealtimeChart.start_updating();
 dontmanage.ui.RealtimeChart.startupdating_
dontmanage.ui.RealtimeChart.stop_updating
dontmanage.ui.RealtimeChart.stop_updating()
Stop listening to the socket event that RealtimeChart was initialized with.
dontmanage.ui.RealtimeChart.stop_updating();
dontmanage.ui.RealtimeChart.update_chart
dontmanage.ui.update_chart(label, data)
Manually updates RealtimeChart by appending the label and associated data to the end of the chart.
dontmanage.ui.update_chart(2, [30]);